

MTConnect integration means connecting an adapter, an agent and a validated Devices XML so machine data becomes readable over HTTP. Before writing any code, check whether your machine controller already ships a vendor adapter or supports SHDR. Once that is confirmed, use the /probe request to discover what the device exposes, then move to /current or /sample to start pulling live values.
TL;DR:
- Most integration issues stem from mismatched dataItemIds or poorly validated Devices XML, which can cause data loss or confusion in downstream systems.
- Deploying one agent per machine is the simplest approach but can become difficult to scale across large plants, whereas hybrid patterns reduce risk with multiple data sources.
- Ensuring that the Devices XML is validated with sample telemetry before connecting live machines prevents costly rework and delays.
- Converting MTConnect streams into KPIs requires reliable data capture, timestamp preservation, and proper mapping to production metrics within an MES like Mestric™.
- Security best practices include segmenting machine networks, restricting agent access with firewalls, and running agents as managed services to ensure operational stability.
A successful MTConnect integration begins with an honest inventory of what you already have, not with writing code. Before touching an adapter or agent, you need to know what each machine on your floor can actually talk to.
This list looks simple, but skipping any item tends to surface as a painful rework later. A Devices XML written without real telemetry samples in hand almost always needs revision once the agent goes live.
Profi tipp: Run the pilot on your oldest and newest machine at the same time. It exposes interface gaps early rather than one at a time.
MTConnect organises data around three roles: the adapter, which sits closest to the machine and reads its native signals; the agent, which collects that data and serves it in a standard format; and the client, which requests information over HTTP. The agent responds with three document types: Devices, which describes the machine’s structure and capabilities, Streams, which carries live and historical observations, and Assets, which covers things like cutting tools or work offsets.

The MTConnect Part 1 fundamentals document sets out the semantic domain model behind this: a shared vocabulary of components and dataItems so that any compliant client can interpret data from any compliant machine without custom parsing logic. Getting the Devices XML right is not a formality. It is the definition that everything downstream depends on.
MTConnect is deliberately read-only. A client can request data but cannot send commands back to the machine, which removes an entire category of safety and cybersecurity risk that write-capable protocols carry.
Within the Streams document, dataItems fall into a handful of common categories. SAMPLE items report continuous or numeric values such as LOAD or TEMPERATURE. EVENT items report discrete states such as a program name or an alarm code. CONDITION items report machine health states. STATE-type values, such as whether an axis is running or idle, typically appear as events tied to a controller component. Knowing which category a signal belongs to determines how you model it in the Devices XML and how a client should interpret changes over time.
Start by deciding your adapter approach. Some controllers, such as certain LinuxCNC configurations, offer native MTConnect support. Others ship a vendor adapter from the machine builder. When neither exists, you write a custom adapter, commonly in Python or C++, that reads native signals and reformats them as SHDR (Simple Hierarchical Data Representation).
curl against the agent’s /probe endpoint to confirm the device model matches what you expect./current for a snapshot of the latest values and /sample for a time-bounded history, watching for correct sequence numbers and timestamps.The MTConnect adapter tutorial walks through a simple Python SHDR server: open a TCP socket, accept the agent’s connection, then send formatted SHDR lines on an interval. It is a reasonable starting template even if your production adapter ends up considerably more involved.
Devices XML mistakes are the most common source of failed pilots. A mismatched dataItemId between the adapter and the XML means the agent simply drops the value with no obvious error. Missing units on a SAMPLE item, or an incorrect component hierarchy that nests an axis under the wrong controller, will pass basic validation but produce a device model that confuses any client trying to interpret it.
Profi tipp: Validate your Devices XML against a sample SHDR feed before connecting a real machine. Catching a naming mismatch on a test bench costs minutes; catching it on a live spindle costs a shift.
Before calling a pilot complete, confirm four things: the device model validates cleanly, the adapter connects and stays connected, the agent serves current data without gaps, and a client, whether a browser, a script or your MES, can read and interpret the stream correctly.
Once an agent is serving reliable data, the next decision is how that data reaches the systems that use it. The MTConnect Knowledge base notes that integration to MES, ERP or cloud platforms is typically handled through middleware or edge gateways rather than by writing a bespoke XML parser inside every consuming application. That middleware translates MTConnect streams into OPC-UA, MQTT topics or rows in a SQL or time-series database.
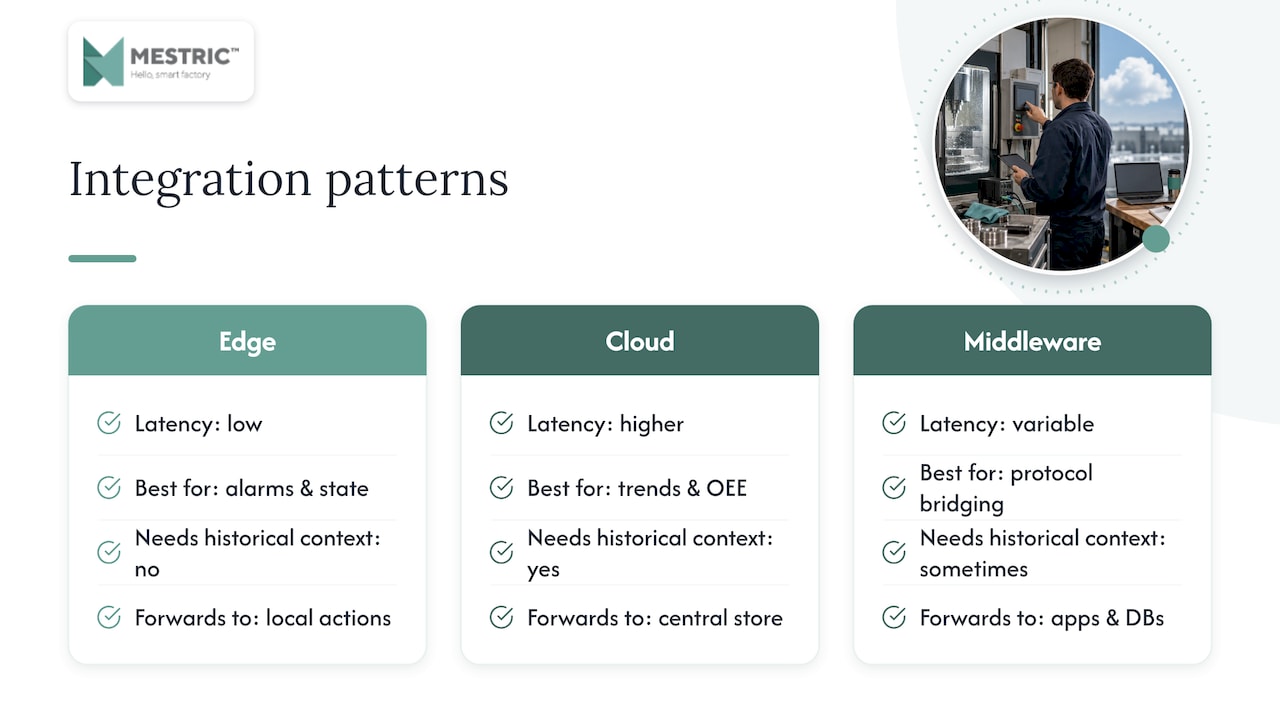
The choice between edge and cloud processing depends on what you need immediately versus later. Calculating machine state changes or flagging an alarm condition benefits from edge processing, since it needs low latency and doesn’t require historical context. Trend analysis, quality correlation across shifts and long-term OEE reporting are usually better handled by forwarding raw or lightly transformed streams to a central store.
For OPC-UA specifically, NIST has tested a companion specification that maps MTConnect’s XML structures directly into OPC-UA, giving clients that already speak OPC-UA a defined path in rather than a custom translation layer.
Whichever path you choose, preserve the original MTConnect timestamps and sequence numbers through every translation step. An MES calculating OEE or cycle time distributions depends on that timing data being intact; losing it at a translation boundary quietly corrupts every downstream metric.
You rarely need to build an MTConnect agent from scratch. Several reference implementations and examples already cover the common cases.
Open-source tools are the right starting point for most pilots since they let you validate the architecture before committing to a vendor’s implementation. Reach for a vendor adapter when the machine builder already supports MTConnect natively, since it typically saves weeks of mapping work over a custom build.
The simplest deployment runs one agent per machine, which keeps commissioning straightforward since each agent has a single, well-defined device model. It scales awkwardly, though, once you are managing dozens of agents across a plant.
A central agent design, where one agent process serves multiple machines, reduces the number of moving parts a client needs to query but concentrates risk: one agent failure affects every machine behind it. The NIST Smart Manufacturing Systems Test Bed report documents a hybrid aggregator pattern that sits between these extremes, combining data from several source agents and supporting a replay capability that simplifies maintenance without taking every machine offline at once. NIST’s report treats the adapter, agent and Devices XML as the non-negotiable minimum regardless of which deployment pattern you choose.
Network resilience matters as deployments grow. Firewalls and NAT between machine networks and your integration layer need explicit rules for agent ports, and MQTT deployments benefit from retained topics on the Probe response so new subscribers can discover device capabilities immediately rather than waiting for the next full update.
A sensible rollout follows pilot, then cluster, then plant-wide, with monitoring in place at each stage and every Devices XML change tracked in version control.
Verification does not require guesswork. A handful of concrete checks confirm whether an integration is production-ready.
/probe and confirm the returned device model matches your Devices XML exactly, component by component./current and /sample over a realistic period, checking that sequence numbers increment without gaps and timestamps stay consistent with wall-clock time.For ongoing monitoring, track lastSequence lag between what the adapter sends and what the agent has processed, watch poll latency on client requests, and alert on missing data rather than waiting for someone on the floor to notice a stale dashboard.
Most MTConnect faults trace back to a small set of causes. Malformed Devices XML, a mismatched dataItemId between adapter and agent, clock skew between machine and server, and adapters that silently disconnect under network load account for the majority of pilot issues.
Start any diagnosis with a curl request against /probe, comparing the returned model against your XML file line by line. If the model looks correct but values are not updating, capture the raw SHDR stream from the adapter and check that timestamps and dataItemIds match what the agent expects.
Because MTConnect is read-only, it removes the risk of a compromised client issuing commands to a machine. That does not remove every risk. Segment machine networks from general IT traffic, apply firewall rules that restrict which hosts can reach agent ports, use TLS where your agent implementation supports it, and apply role-based access control on any downstream system, such as an MES, that consumes the data.
Operationally, run the agent as a managed service rather than a manual process so it restarts automatically after a reboot, back up your Devices XML files, and keep every device model under version control so a bad change can be rolled back quickly.
Once an agent is serving validated streams, an MES sits on top as the integration layer, pulling current and sample data, mapping it to production KPIs, and presenting it on a dashboard a plant manager can act on. Mestric™ works this way: it connects to the agent, ingests the stream, and turns raw observations into figures like OEE, downtime duration, cycle time distribution and quality event correlation.
A typical pilot follows the same shape as the integration checklist above: discover the device model, confirm tag mapping against real telemetry, configure the dashboard around the KPIs that matter to that floor, and track early results over a short window before deciding whether to scale. The pricing and scope of a specific pilot with Mestric™ is available on request rather than published, since it depends on the number of machines and the KPIs a plant wants to track first.
The standard itself is not the hard part. Reading the MTConnect fundamentals document and setting up a reference agent against a test machine is a weekend’s work for a competent engineer. The part that actually determines whether a project succeeds is the Devices XML, and it is the part most guides rush past.
Conventional advice treats device modelling as a checkbox between “install the agent” and “connect the MES”. In practice, an inaccurate device model is why pilots stall: dashboards show gaps, KPIs look wrong, and nobody can tell whether the machine or the mapping is at fault. Fix the model first, on one or two machines, before writing a single line of downstream integration code.
If you take one thing from this guide, prioritise a validated device model over broad coverage. A plant with three machines correctly modelled beats twenty with a rough one.
Building an MTConnect pipeline from scratch takes engineering time most plants would rather spend on production. Some MES providers offer onsite demonstrations and pilot services that connect existing MTConnect agents, or help stand up new ones, directly into the MES so you can see live KPIs on real machines rather than a slideshow.
A typical MES pilot covers:
If you already have an MTConnect stream running, or you are still deciding on an adapter approach, the Mestric™ MES solution page outlines how the platform connects to machine data and turns it into the KPI tracking manufacturers rely on. Reach out through the site to scope a pilot for your floor.
For readers working in precision machining environments, tight tolerance machining guidance offers useful context on the processes MTConnect telemetry often monitors.
The adapter reads native signals directly from a machine controller and reformats them, typically as SHDR, while the agent collects that data and serves it over HTTP in the standard’s XML documents. A client only ever talks to the agent, never directly to the adapter.
No. MTConnect is a read-only standard, so a client can request or subscribe to data but cannot issue control commands back to the equipment, which removes an entire category of write-access security risk compared with control protocols as explained in the MTConnect model documentation.
/current returns a snapshot of the most recent value for every data item, useful for a live dashboard. /sample returns a time-bounded history of observations with sequence numbers, according to RTAutomation’s overview of MTConnect, which is what you use to analyse trends or reconstruct events after the fact.
Not necessarily. Some controllers, such as certain LinuxCNC setups, include native MTConnect support, and you can also write a custom SHDR adapter in Python or C++ when no vendor option exists. Checking for an existing adapter first, however, usually saves considerable development time.
An MES connects to the MTConnect agent’s stream and maps the incoming data items to production KPIs such as OEE, downtime and cycle time. Mestric™ follows this pattern, ingesting validated MTConnect streams and turning them into dashboards a plant manager can use for day-to-day decisions.


 069 763 552