

Alarmiranje v proizvodnji means using MES-generated alerts to flag machine status changes, downtime and quality deviations, then escalating them automatically to the right person. The recommended pattern is source-modelled alarms with clear severity tiers, timed escalation and a full audit trail, aligned with standards like IEC 62682 and ISA-18.2. Platforms such as Mestric™ build this directly into the shop floor workflow.
TL;DR:
- Most effective alarm systems classify alerts at the source using OPC UA standards to ensure accurate, reliable, and MES-compatible downtime attribution.
- Regular auditing of alarm severity levels and thresholds is essential to prevent misclassification, alarm flooding, and deterioration of trust in the system.
- Routing alerts based on skill groups and implementing hierarchical escalation with defined timers improves responsiveness and creates valuable data for planning.
- Operator training must focus on understanding severity levels, proper acknowledgement, and systematic handling to reduce response times and increase trust.
- Incorporating AI for predictive analytics and alarm grouping enhances early problem detection and reduces alarm overload, but it supplements rather than replaces a well-managed alarm framework.
An MES alarm system earns its place on the shop floor only if it does five things well. Get these wrong and you end up with an alert feed nobody trusts.
Alarm notification platforms that route SCADA, MES and PLC alerts to operators in under two seconds with multi-channel delivery and audit trails demonstrate how far the technology has moved from simple horn-and-light systems. Speed alone isn’t the goal, though. Trustworthy classification matters just as much as fast delivery.
Severity mapping is where most alarm systems succeed or fail. ISA-18.2 and IEC 62682 both frame alarm management as a lifecycle, not a one-off configuration task, and IChemE’s practical guide recommends auditing alarm sets regularly rather than trusting the original setup to stay accurate as production changes.
A workable starting taxonomy looks like this:
| Tier | Meaning | Typical response |
|---|---|---|
| P1 | Critical: stop condition or safety risk | Immediate, escalates within minutes |
| P2 | Urgent: quality or throughput at risk | Fast response, short escalation window |
| P3 | Warning: trending toward a problem | Reviewed within the shift |
| P4 | Informational: no action required now | Logged for trend analysis |
Every threshold needs a deadband or dwell time before it fires, otherwise a parameter hovering near a limit floods the log with duplicate alarms. Run a pilot period where supervisors review every classification, then decide who is allowed to adjust thresholds afterwards and log every change. Without that governance layer, tuning drifts back to guesswork within months.
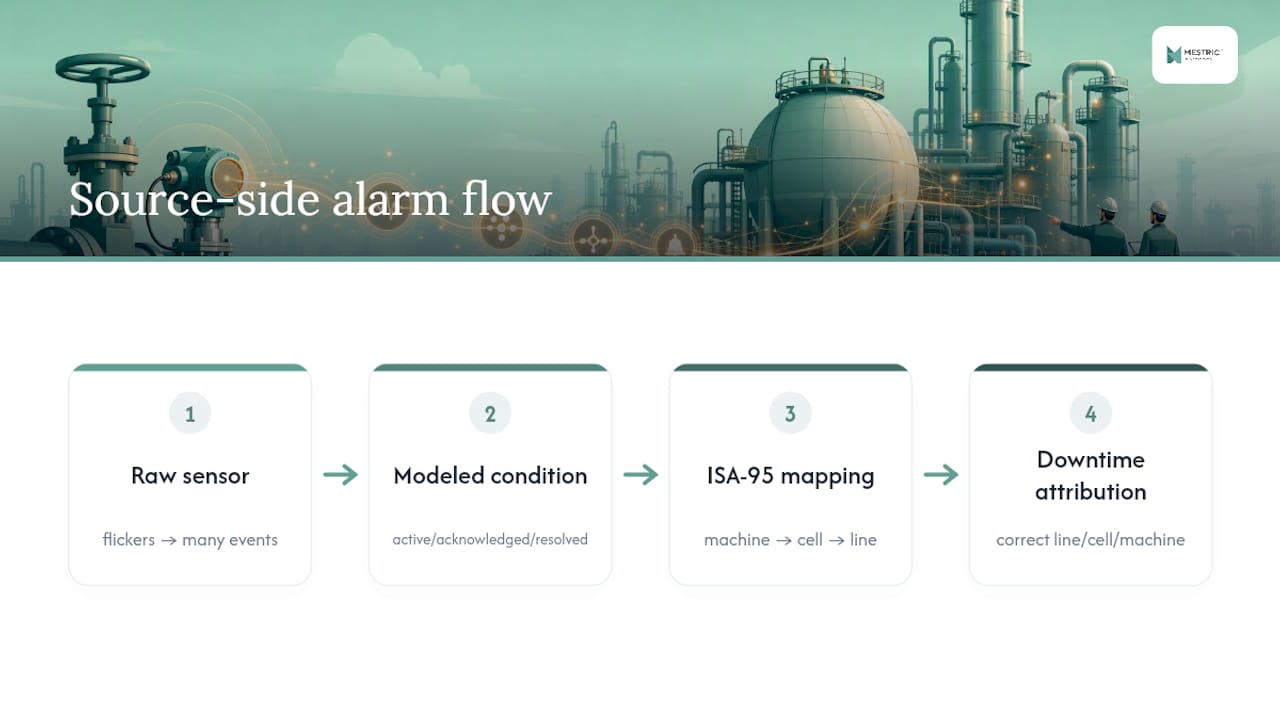
Alarms should be classified as close to the equipment as possible, using OPC UA’s Alarms & Conditions specification, rather than left for the MES to interpret raw signals downstream. The ConditionType and AlarmConditionType objects carry lifecycle fields like Acked and Retain, which tell every downstream system whether an alarm is active, acknowledged or resolved without any guesswork.
Subscribing to raw tag changes instead of properly modelled conditions is a common shortcut, and it’s the reason so many MES downtime reports look noisy or simply wrong. A flickering sensor produces dozens of meaningless events; a properly modelled condition produces one. Attaching each SourceNode to an ISA-95 equipment hierarchy means downtime gets attributed to the correct line, cell or machine automatically, which matters enormously once you start running Pareto analysis on stoppages. Shelving and deadband logic belongs at this source level too. Classification done closest to the equipment stays reliable and MES-ready, rather than something the MES has to second-guess.
Routing is the part teams most often leave informal, which is exactly why alerts get missed on the night shift. Build a routing table before you build anything else.
A hierarchical, time-controlled escalation structure with defined solver groups improves responsiveness in high-mix, low-volume plants and creates a learning loop for future planning, because every escalation event becomes data on where recurring gaps sit in your coverage.
Consistency here is what makes the whole system auditable. For P1 and P2 alarms, require an explicit acknowledgement, and log the timestamp and the user who acknowledged it. That single record is often the difference between a defensible incident report and a shrug.
Shelving needs the same discipline: a timed shelve with a mandatory justification note, and an automatic unshelve once the window expires so nothing silently disappears from view. Before closure, capture the root cause, the corrective action taken and the actual resolution time, not just a tick box marked “fixed”. Where the alarm points to a mechanical or electrical fault, the workflow should automatically create or link a CMMS work order, so the fix gets tracked through to completion rather than living only in the alarm log.
Alert fatigue kills more alarm systems than bad software does. Operators who get 200 notifications a shift stop reading any of them, including the one that matters.
Run a pilot of two to four weeks where supervisors personally review every alert classification generated, and adjust thresholds based on what they see rather than what the original spec assumed. When a point fires repeatedly, fix the underlying cause (a worn sensor, a badly set deadband, a process drifting near its limit) rather than suppressing the alarm and hoping it goes away. Suppression without a fix just hides a real problem.
Keep the rules for assigning P1 status strict, because severity inflation is one of the fastest ways to destroy trust in the system: if everything is critical, nothing is. Weekly threshold reviews during ramp-up catch this early. Frequency and duration reports across all your alarm points tell you which ones need a deadband adjustment, which need a repair, and which need redesigning entirely, rather than permanent tuning.
Metrics turn alarm management from a compliance exercise into a genuine improvement lever. Track time-to-first-acknowledge, mean time to repair (MTTR), alarm frequency per point, recurrence rate, and the percentage of alarms shelved rather than resolved. A rising shelve rate is usually a warning sign that thresholds need another look.
Downtime is expensive, and the first minutes decide the cost. Unplanned downtime runs to roughly 11% of annual revenue for large manufacturers, and the outcome is largely set in the first few minutes after an alarm fires, before most human intervention even begins.
Post-incident reports should always include the equipment ID, stoppage duration, response time and the corrective action taken, structured consistently enough that you can run Pareto analysis across a month of incidents. Weekly reliability summaries built from this data tell you which lines or machines deserve engineering attention first, rather than spreading maintenance effort evenly across the plant.
Trying to alarm the entire plant on day one is how pilots collapse under their own weight. A phased rollout keeps the workload manageable and the trust-building genuine.
Retain rules correctly.Profi tipp: Don’t let the pilot line be your easiest line. Pick one with a genuine history of nuisance alarms, because that’s where you’ll learn the most about deadbands and severity mapping before you scale.
An alarm nobody can read fast enough might as well not exist. Screen layout, colour coding and alert phrasing all determine how quickly an operator understands what’s happening and what to do about it, and this matters just as much as the underlying detection logic.
Alarms competing for attention on a cluttered HMI screen slow response, particularly during a flood when several conditions fire together. Consistent colour conventions (red genuinely reserved for critical, amber for urgent) help operators triage at a glance rather than reading every message in full. Alert text should state the equipment, the parameter and the expected action in plain language, not a cryptic tag code that only the engineer who wrote it understands.
Shift patterns matter too. Fatigue late in a night shift measurably slows acknowledgement times, which is one more reason escalation timers need to account for shift, not just elapsed time. Physical placement of Andon lights, radios and screens should follow where operators actually stand when a line stops, not where it was convenient to mount the hardware during commissioning.
Involving the operators who’ll actually use the system in the design workshop, rather than handing them a finished configuration, consistently produces alarm setups that get acknowledged faster and shelved less arbitrarily. People trust a system they helped build far more than one imposed on them, and that trust shows up directly in acknowledgement times once the pilot goes live.
An alarm flood happens when a single upstream event, a power dip, a sensor failure, a process excursion, triggers dozens or hundreds of downstream alarms within seconds. Tuning individual thresholds afterwards doesn’t fix a flood; it just changes which alarms fire.
The most common root cause is poor fault propagation logic: one root fault (a compressor tripping, say) cascades into alarms on every piece of equipment downstream that depends on it, none of which are actually broken. The fix is root cause suppression logic built into the alarm model itself, so dependent alarms are automatically linked to the trigger condition rather than firing independently.

Badly chosen deadbands are the second major cause, particularly on analogue signals sitting close to a limit. A flow reading oscillating around its low limit can generate an alarm every few seconds for hours. Fixing this means widening the deadband or adding a dwell time, not just acknowledging the same alarm repeatedly.
Equipment start-up and shutdown sequences are a third common trigger, since normal transients during a planned stop or restart often look identical to fault conditions to a poorly configured system. Building start-up and shutdown states into the alarm logic, so expected transients are suppressed automatically during those windows, removes a large share of flood events without touching a single threshold. Reviewing flood events specifically, rather than folding them into general alarm frequency reports, is the only way to spot these patterns.
The best-configured alarm system fails if operators don’t understand what each severity tier means or don’t trust the escalation chain to actually reach someone. Training is not a one-off induction session; it needs to be treated as ongoing competency development.
New operators need to learn the severity taxonomy before they touch a live line: what distinguishes a P1 from a P2, what acknowledgement actually commits them to, and when shelving is appropriate versus when it’s masking a problem. Skipping this step is how severity inflation creeps in, with operators marking everything critical because they were never taught the difference.
Refresher training matters just as much as initial onboarding, particularly after any change to thresholds or routing. An operator who learned the system eighteen months ago is working from an outdated mental model if thresholds have since moved. Competency checks tied to actual incident handling, not just a classroom quiz, give a far more honest picture of whether training has landed.
Cross-training across specialisms (electrical, mechanical, quality) also pays off directly in escalation performance, because a technician who understands why an alarm was routed to them responds faster than one who’s simply following an instruction. Building this understanding into onboarding, rather than assuming it develops naturally on the job, shortens the time it takes new hires to become reliable first responders.
Static thresholds catch problems after they’ve already started. Advanced analytics and predictive models aim to catch the drift before it crosses a limit at all, which changes the nature of the alert from reactive to genuinely preventive.
Pattern recognition across historical alarm data can flag when a machine’s behaviour resembles the lead-up to a past failure, even if no single parameter has breached its threshold yet. This kind of predictive alerting works best layered on top of solid source-side modelling, not instead of it. A model trained on noisy, badly classified alarm data will learn the noise as readily as the signal.
Anomaly detection also helps with the flood problem discussed earlier, by learning which combinations of alarms typically arrive together from a single root cause and automatically grouping them, so an operator sees one flagged event instead of forty. This is one of the more genuinely useful applications of AI in manufacturing right now, precisely because it works on data the plant is already generating rather than requiring new sensors.
The realistic expectation is incremental improvement, not a fully autonomous alarm system. Predictive analytics extends the reach of a well-designed alarm framework; it doesn’t replace the taxonomy, escalation rules or governance discussed earlier in this guide.
Consider a mid-sized packaging line running three shifts, where unplanned stoppages had been logged manually and inconsistently for years. The team’s first move wasn’t to buy new hardware; it was to run a severity taxonomy workshop with supervisors and map which alarms actually mattered against ISA-95 equipment codes. That single exercise revealed that over a third of logged “critical” stops were sensor faults, not process faults, a classic case of severity inflation.
During the pilot, supervisors reviewed every alert generated on one line for three weeks. They found that a single flow sensor accounted for roughly a fifth of all alarms fired that period, purely because its deadband was too tight. Widening it eliminated most of that noise overnight, with no change to escalation logic at all.
Escalation only became genuinely useful once contacts were mapped to specialisms rather than individuals. A hierarchical, time-based escalation approach that routes disturbances to defined solver groups rather than named people, tested in high-mix production environments, gave measurable improvements in responsiveness precisely because coverage didn’t collapse when a specific person was on leave. The pattern holds regardless of industry: get the taxonomy and the deadbands right first, then layer escalation and analytics on top.
Most failures trace back to two habits: skipping the pilot calibration because it feels slow, and letting severity creep upward until every alarm is marked critical. Both are avoidable with a short, disciplined review period and strict governance over who can change thresholds.
Mestric™ builds real-time alerting, escalation workflows and audit trails directly into its MES dashboards, which removes the disconnect between shop floor events and the KPI data managers actually review. A short pilot on one line, with simple, written governance rules, is the fastest way to find out whether your current setup is trustworthy.
— Andraž
Mestric™ builds real-time alerts, tiered escalation workflows, KPI dashboards and full audit trails directly into the shop floor data your machines already produce, which is precisely the setup this guide has walked through. Rather than bolting a separate notification tool onto your existing systems, Mestric™ connects to your equipment directly, models conditions properly, and routes them to the right person before a small stoppage turns into a costly one.

If your team is still chasing missed alarms in spreadsheets or WhatsApp threads, a working MES platform closes that gap without a lengthy overhaul. You can see how real-time performance tracking and alert escalation work together on an actual production line by requesting an onsite demonstration. Book that walkthrough now and bring one pilot line’s alarm history with you. It’s usually enough to show exactly where your current setup is losing time.


 069 763 552