

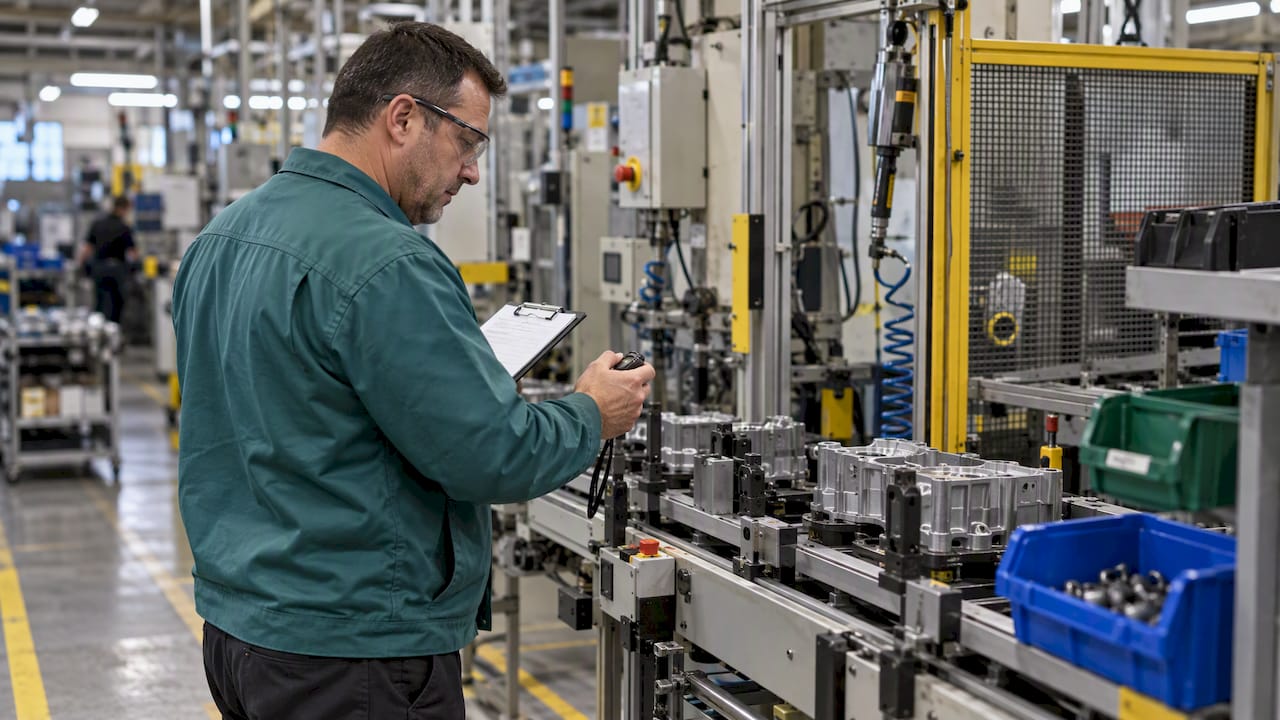
Track four numbers first: Availability, Performance and Quality (the three OEE components), then cycle time, error rate, first-pass yield and micro-stoppages at operator level. The immediate first action is a focused two-week baseline on your biggest bottleneck, captured manually or through your MES. Build in a human-centred approach and privacy safeguards from day one, not as an afterthought.
Kurzfassung:
- Focusing on micro-stoppages and set-up time can provide early warning of declining availability before it affects overall equipment effectiveness.
- Stratifying operator data by shift, machine, and individual helps identify targeted improvement areas and prevents reliance on plant-wide averages.
- Conducting a two-week manual baseline on the biggest bottleneck before deploying sensor or MES tools ensures effective targeting and resource allocation.
- Monitoring should incorporate operator wellbeing measures like workload ratings alongside performance data to better address human factors.
- Ensuring transparency, purpose limitation, and operator involvement in data collection is crucial for lawful and fair long-term operator tracking.
Overall Equipment Effectiveness remains the backbone of any monitoring programme, but applying it to individual operators takes a bit more care than applying it to a machine. Availability measures how much of the planned time an operator or line actually runs, Performance compares actual output speed against the ideal cycle time, and Quality tracks the share of units that pass first time. The tricky part is attribution: a machine fault lowers Availability regardless of who is operating it, but a slow changeover or a hesitant response to a jam often sits squarely with the operator. Separating the two requires clean event logging, which is why per-machine and per-operator reporting works best as two parallel views rather than one blended figure.
Beyond OEE, a handful of operator-level KPIs fill in the picture:
Some of these are leading indicators. Micro-stoppages and set-up time tend to move before Availability drops noticeably, so watching them gives you a few days’ warning rather than a monthly surprise. First-pass yield and error rate are more lagging: by the time they shift, the root cause has usually been active for a while. Converting percentages into money focuses attention fast. A five-point drop in Performance on a line running at €40 of output per hour translates into a measurable loss across a full shift, and that figure tends to move a conversation in a way that a percentage alone does not.
Multiply the three and the operator’s OEE for that shift comes out at roughly
, a useful single figure for trend tracking even though the underlying causes still need separating out.
Choosing how to collect operator data matters as much as choosing what to collect. Three approaches dominate, each suited to a different stage of maturity.
Pro-Tipp: Run manual logging for your two-week baseline, then move the confirmed bottleneck straight onto sensor or MES capture rather than waiting for a full plant-wide rollout.
Manual logging has a real role even once you have better tools: it is quick to deploy on a line that has not yet been instrumented, and it forces someone to stand on the floor and watch, which surfaces context that a dashboard alone will not. Its limits show up fast, though, once you need to rank dozens of short stoppages a shift or compare three shifts’ worth of data without introducing recording errors.
Wearables and physiological sensors are not for every line. They earn their place where cognitive or physical load is a genuine concern, such as high-pace assembly or tasks with repetitive strain risk, and they should always be introduced with clear consent and a stated purpose. For most production KPIs, machine-side sensors paired with MES event logs do the job without putting anything on the operator’s body.
The practical sequence for most plants is a hybrid one: start with a manual pilot to confirm where the real bottleneck sits, then bring in MES or sensor coverage on that specific line before expanding further. This avoids the common trap of instrumenting an entire plant before knowing which problem is worth solving first.
Raw OEE and KPI numbers tell you little until you break them down. Stratifying results by machine, shift and individual operator is what turns a single plant-wide average into something you can act on.
Decomposing OEE back into its Availability, Performance and Quality components tells you which lever to pull. A low Availability score usually means breakdowns or changeovers; a low Performance score points to pacing or minor stops; a low Quality score points to defects and rework. Practitioner guidance recommends reporting OEE per machine, stratifying by shift and operator, and ranking micro-stoppages by frequency and duration as the fastest route from measurement to action, backed by regular TPM audits to keep the data honest.
Once you know where the loss sits, a Pareto chart of stoppage causes usually shows that a small number of causes account for most of the lost time. From there, the fix maps to a known tool: SMED for slow changeovers, SPC for quality drift, and broader TPM routines for recurring breakdowns.
Performance figures alone miss half the picture. Industry 5.0 thinking argues that monitoring should support the operator, not just judge them, by factoring in wellbeing and risk alongside output.
A 2025 assembly study found that subjective workload ratings (RSME) correlated strongly with completion time and error rate, while heart rate variability showed weaker correlations in the same sample, a reminder that triangulating performance, subjective and physiological measures catches more than any single method alone. Operator-centred monitoring that pairs effectiveness indicators with risk assessment helps allocate tasks more sensibly and cuts error-driven quality defects.

In practice, this does not require invasive equipment. A short RSME-style rating scale after a demanding shift, or a brief interview during a shift handover, gives you most of the subjective signal you need. Physiological sensors are worth reserving for specific high-risk or high-pace tasks rather than blanket deployment. Human-cyber-physical systems that combine physiological, environmental and process data can flag risk profiles early enough to act, feeding directly into ergonomic adjustments, task rotation, extra training or staffing changes before a problem becomes a trend.
Monitoring operators only works long-term if it is lawful and seen as fair. Before any rollout, work through the following:
Pro-Tipp: Share aggregate team results in daily briefings and keep individual figures visible only to the operator and their direct supervisor, never on a shared screen.
Deploying digital tools without operator involvement tends to backfire: continuous surveillance without participation can raise stress and even reduce the productivity it was meant to improve. Involve operators in choosing what gets measured, communicate changes before they happen, and consult legal or HR whenever a new sensor or wearable programme is on the table.
A pragmatic rollout moves in three stages rather than one big-bang deployment.
EU-backed initiatives such as the SMARTY project show there are established regional paths for SMEs to combine monitoring tools with structured training and policy support, which is worth checking before you build an implementation plan from scratch. A step-by-step optimisation guide can help structure the validate and scale phases once the pilot has proven its point.
The most common mistake is skipping stratification: a single plant-wide OEE number hides which shift, machine or operator actually needs attention. The second is building a dashboard that only tracks performance, which operators quickly read as punitive, especially when no one follows up with action. The third is collecting data and never closing the loop.
Adoption improves when operators see the numbers used to solve their problems, not to rank them. Short daily briefings focused on team-level wins, paired with visible follow-through on reported issues such as a recurring jam or a slow changeover, do more for buy-in than any dashboard redesign. Safety and reliability tie together here too: safety-focused practices often surface the same root causes as efficiency monitoring, since a near-miss and a micro-stoppage frequently share a cause.
Most plants over-invest in dashboards and under-invest in the two-week baseline that would tell them which line deserves the dashboard in the first place. The conventional advice treats monitoring as a technology purchase: buy sensors, wire up the MES, watch the numbers climb. That skips the harder, cheaper step of figuring out by hand where the loss actually sits, which a manual pilot does in a fortnight for the cost of an observer’s time.
The bigger gap we see is treating operator wellbeing as separate from operator performance, when the evidence increasingly says they move together. A line with high cognitive load produces more defects and more micro-stoppages, whether or not anyone is tracking fatigue. Reading performance data without a subjective or physiological check is reading half the story.
If we had to prioritise one thing for a reader starting from zero, it would be this: instrument the bottleneck, not the plant, and build the human-centred check in from the first week rather than bolting it on once the dashboard is already live.
— Andraž
Once you know which metrics matter and where your bottleneck sits, the next step is turning that into a system that runs without a clipboard. We offer a manufacturing execution system that connects directly to equipment, so Availability, Performance and Quality can show up on a live dashboard rather than in a spreadsheet someone updates at the end of the shift. Micro-stoppage tracking and quality monitoring run continuously, and our AI-powered recommendations flag where a process norm is drifting before it shows up in a monthly report.
A short pilot on your top bottleneck line, the same two-week baseline this guide recommends, typically gives you a clear picture of where time and quality are being lost and an early win to build on before any wider rollout. Visit our Mestric™ MES product page to see what a connected pilot would look like on your own floor, or read through our guide to improving manufacturing efficiency with MES tools for a closer look at how the pieces fit together.
Run a manual, two-week baseline on your biggest known bottleneck before investing in sensors or software. This gives you a confirmed problem area and a reference point to measure any later improvement against.
It varies by line, but Performance losses, such as running below ideal cycle time, are often the most operator-influenced component, while Availability losses more often trace back to equipment. Decomposing OEE into Availability, Performance and Quality for each operator or shift is the only reliable way to tell which one applies to you.
Apply transparency, purpose limitation and data minimisation from the outset: tell operators what is measured and why, collect only what the stated goal requires, and set a clear retention period. Document the legal basis for collection and involve operators in the design before any rollout begins.
Our MES connects directly to production equipment to capture real-time event logs, including micro-stoppages, alongside performance and quality metrics on live dashboards. Pricing and setup details are available on request through our Mestric™ MES page.
Not as a default: physiological signals such as heart rate variability are best reserved for high-risk or high-pace tasks where cognitive load is a genuine concern. For most lines, a short subjective workload scale alongside standard performance data gives a reliable enough picture without the added intrusion.


 069 763 552