


The most damaging raw material planning mistakes share a common root: poor data, invisible supplier commitments, and planning processes that react too late. Fix these first, and most production disruptions become preventable. The core failures are inaccurate bills of materials (BOMs) and master data, forecast bias baked into your demand numbers, unacknowledged purchase orders (POs) sitting outside your ERP, overreliance on spreadsheets, miscalculated safety stock, weak supplier management, receiving and traceability gaps, siloed cross-functional planning, stock-record discrepancies, and no segmentation of materials by criticality.
Before you read further, run these three checks today:
The sections below give you detection signals, a one-day audit checklist, and prioritised fixes for each mistake.
The most preventable production stoppages trace back to a small number of fixable mistakes: unacknowledged POs, inaccurate BOMs, miscalculated safety stock, and forecast bias that no statistical model alone will correct.
| Point | Details |
|---|---|
| Audit POs first | Pull all open POs due within ten weeks and escalate every unacknowledged long-lead line immediately. |
| Recalculate safety stock | Use lead-time standard deviation in the formula (Z × σ(LT) × D_avg) rather than a fixed days-cover figure. |
| Address forecast bias at source | Bias is often cultural; FVA analysis and single-number plan discipline fix what better models cannot. |
| Segment materials by criticality | ABC analysis plus a supply-risk flag ensures planner effort goes to the materials that matter most. |
| Mestric for real-time visibility | Mestric’s MES automates inventory tracking, KPI dashboards, and exception alerts to reduce the manual errors that drive most planning failures. |
Material Requirements Planning (MRP) and broader supply chain planning share a well-documented set of failure modes. The industry term for the discipline is material resource planning, and the mistakes below appear repeatedly across UK factories regardless of sector. Each sub-section names the mistake, its typical cause, its production consequence, the metric to watch, and a single corrective action.
Your MRP output is only as good as the data you feed it. Inaccurate BOMs, wrong unit-of-measure conversions, and stale component codes cause the system to generate incorrect demand signals. The result is either over-ordering (tying up working capital) or under-ordering (stopping the line). Common MRP mistakes consistently list BOM inaccuracies and unreliable inventory records as top root causes. Metric to watch: BOM error rate (errors found per 100 BOM lines audited). Fix: Schedule a quarterly BOM-versus-build inspection for your top 20 products.
Forecast bias is not the same as forecast inaccuracy. A forecast can have a low Mean Absolute Percentage Error (MAPE) and still be systematically high or low, which drives persistent over- or under-procurement. Research from the University of Tennessee shows that forecast bias has not improved at the same rate as statistical accuracy, and that organisational norms and multiple competing forecasts frequently perpetuate it. Metric to watch: Forecast bias (sum of errors divided by sum of actuals, expressed as a percentage). Fix: Run a Forecast Value Added (FVA) analysis to identify which steps in your forecasting process add noise rather than accuracy.
When a supplier changes a delivery date by email and no one updates the ERP, your planning system is working from fiction. Practical procurement guidance identifies unacknowledged POs, stale commit dates, and supplier changes trapped in email as among the most common operational causes of raw-material failures. Metric to watch: PO acknowledgement rate and commit-date accuracy. Fix: Implement a weekly PO acknowledgement sweep and require ERP updates within 24 hours of any supplier confirmation.
Spreadsheets break version control, introduce transcription errors, and cannot alert you in real time. When planners maintain parallel spreadsheet systems alongside the ERP, the two records diverge quickly. Reducing manual entry errors is one of the highest-leverage process improvements available to most plants. Metric to watch: Number of manual workarounds or offline files in active use. Fix: Identify the three most-used spreadsheets and map what ERP functionality could replace them within 30 days.
Safety stock calculated without accounting for lead-time variability will fail you precisely when you need it most: when a supplier is late. The standard safety-stock formula is:
Safety stock = Z × σ(LT) × D_avg
Where Z is the service-level factor (e.g. Many plants use a fixed number of days’ cover, instead, which ignores variability entirely. The reorder point (ROP) is then: ROP = (D_avg × LT_avg) + Safety stock. Metric to watch: Stockout frequency per SKU per quarter. Fix: Recalculate safety stock for your top 20 SKUs using actual lead-time standard deviation from the last 12 months of supplier data.
No acknowledgement workflow, poorly defined SLAs, and no escalation path for late deliveries are process gaps that compound over time. When on-time inbound delivery falls, planners compensate with larger buffers, which masks the root problem. Metric to watch: On-time inbound delivery rate by supplier. Fix: Define a three-tier escalation: auto-alert at 7 days before due date if unacknowledged, planner contact at 5 days, management escalation at 3 days.
Materials received without proper inspection or lot-tracking create quality rejects mid-production and stock discrepancies that take days to resolve. A case study applying Fishbone and ECRS (Eliminate, Combine, Rearrange, Simplify) analysis in a manufacturing plant demonstrated that structured root-cause methods reduce accounting errors and improve compliance when paired with staff training. Metric to watch: Goods-in rejection rate and lot-traceability coverage. Fix: Require lot numbers on all goods-in transactions and audit traceability weekly for your top 10 materials.
When sales, procurement, and production plan independently, the demand signal reaching your MRP is already distorted. Demand-Supply Integration (DSI) and Sales & Operations Planning (S&OP) exist to create a single agreed number. Without a named owner for the S&OP process, decisions default to whoever shouts loudest. Metric to watch: Frequency and attendance of S&OP meetings; plan-versus-actual variance at the product-family level. Fix: Assign a single owner for the demand-supply integration process and set a fixed monthly cadence with mandatory cross-functional attendance.
System records and physical counts diverge through missed transactions, mis-picks, and returns not booked correctly. Fishbone and FMEA analysis identify manual data entry errors, inconsistent workflows, and incompatible software as high-risk causes of stock discrepancies. Metric to watch: Cycle-count variance (percentage of counted SKUs with a discrepancy above tolerance).
Treating a commodity consumable with the same planning rigour as a single-source, long-lead critical component wastes planner time and leaves genuine risks unmanaged. ABC segmentation by value, combined with a separate criticality flag for supply-risk items, gives you a practical prioritisation framework. Metric to watch: Percentage of critical-A items with a documented contingency supplier. Fix: Complete an ABC analysis and add a supply-risk flag to any item with a single source or lead time above 12 weeks.
Lead times are not static. Supplier performance, port congestion, and carrier capacity all shift them. Metric to watch: Lead-time variance (actual versus system lead time) for critical suppliers. Fix: Set a quarterly lead-time review for all A-category and supply-risk materials, and update ERP parameters immediately after each review.
Without automated alerts, planners discover problems only when they run a report or a line stops. Real-time dashboards and exception-based alerts shift the planner’s role from firefighting to proactive management. Metric to watch: Mean time to detect a planning exception (hours from event to planner awareness). Fix: Configure ERP or MES alerts for unacknowledged POs, safety-stock breaches, and BOM errors as a minimum.
Quick-reference table: highest-risk mistakes
| Mistake | Metric to watch | Warning value | Fast fix |
|---|---|---|---|
| Inaccurate BOM / master data | BOM error rate | >2 errors per 100 lines | Quarterly BOM-vs-build audit |
| Forecast bias | Bias % (errors/actuals) | Consistently >±10% | Run FVA analysis; single-number plan |
| Unacknowledged POs | PO acknowledgement rate | <95% within 48 hours | Weekly PO sweep; ERP update SLA |
| Wrong safety stock | Stockout frequency | >1 stockout per SKU per quarter | Recalculate using lead-time σ |
| Stock-record discrepancy | Cycle-count variance | >3% of counted SKUs | Rolling cycle-count programme |
| No material segmentation | Critical-A items with backup supplier | <75% coverage | ABC + supply-risk flag |
| Stale lead times | Lead-time variance | >15% vs system value | Quarterly lead-time review |
| Manual workarounds | Active offline files | Any in use for live planning | Map to ERP replacement within 30 days |
Knowing which metric to watch is only useful if you know what an abnormal reading looks like. The table below gives definitions, sample warning thresholds based on common practice, and the immediate diagnostic step when a threshold is breached.
| KPI | Definition | Warning threshold | Immediate diagnostic step |
|---|---|---|---|
| MAPE (material level) | Mean absolute percentage error of demand forecast at SKU level | >25% for finished goods | Segment by product family; check for outliers distorting the average |
| Forecast bias | (Sum of forecast errors) ÷ (Sum of actuals) × 100 | Consistently above +10% or below –10% | Identify which step in the forecasting process introduces the bias; run FVA |
| PO acknowledgement rate | % of PO lines acknowledged by supplier within agreed SLA | <95% | Pull unacknowledged lines; contact supplier; escalate long-lead items |
| Commit-date accuracy | % of PO lines where supplier’s commit date matches original due date | <90% | Review open POs for date drift; update ERP; flag for expediting |
| On-time inbound delivery | % of PO lines delivered on or before the commit date | <75% | Identify repeat offenders; review SLAs; consider dual-source for critical items |
| Inventory days on hand | Average stock value ÷ daily cost of goods sold | >30 days for fast-movers; <5 days for critical items | Check reorder points and safety-stock settings; review recent demand changes |
| Stockout frequency | Number of stockout events per SKU per quarter | >1 per critical SKU | Recalculate safety stock; check lead-time accuracy in ERP |
| Cycle-count variance | % of counted SKUs with a discrepancy above tolerance (e.g. ±2%) | >3% of counted SKUs | Investigate top-variance items; check receiving and issue transactions |
MAPE is computed as the average of |(Actual – Forecast) / Actual| × 100 across all periods. It tells you the average size of your error but not its direction. Forecast bias tells you the direction: a persistently positive bias means you are over-forecasting, which drives excess stock; a negative bias drives stockouts.
PO acknowledgement rate and commit-date accuracy are the two most immediately actionable KPIs for most UK plants. Tracking acknowledgement rate, supplier response time, and late PO lines gives you early warning before a delivery failure becomes a line stoppage.
Pro Tip: Set up a weekly one-page KPI dashboard covering these eight metrics. If you can see all of them in a single view, you will catch most planning problems before they reach the shop floor.
You can run this audit in a single shift. Collect evidence as you go and triage findings into three workstreams: Safety (act within 24–72 hours), Process (fix within 2–6 weeks), and Tech (automate within 3–6 months).
Step 1: PO acknowledgement sweep
Pull all open POs due within the next ten weeks. Count lines without a supplier acknowledgement.
Step 2: Three-item cycle-count sample
Select three high-value or high-risk SKUs at random. Count physically and compare to ERP. Zero discrepancies on all three is Low, but do not stop there: expand the sample monthly.
Step 3: BOM versus build inspection
Pick two recently completed production orders. Compare the BOM quantity issued against the actual quantity consumed.
Step 4: Lead-time sample for critical suppliers
For your five most constrained materials, compare the ERP lead time to the last confirmed supplier lead time. Update ERP immediately for High findings.
Step 5: Safety-stock calculation review
For your top ten SKUs by value, check whether safety stock was calculated using lead-time variability or simply set as a fixed number of days. Fixed-days settings with no variability adjustment are a Medium finding for stable suppliers and High for variable ones.
Step 6: Open PO review for stale dates
Identify PO lines where the commit date has not been updated in more than 21 days. Any long-lead item (>8 weeks) with a stale date is a High finding.
Step 7: Spreadsheet and manual workaround check
Ask your planning team to list every spreadsheet or offline file they use for live planning decisions. Any active workaround that substitutes for ERP functionality is a Medium finding; one that substitutes for a safety-critical control is High.
Step 8: S&OP and DSI governance check
Confirm whether a formal S&OP or Demand-Supply Integration meeting takes place at least monthly, with cross-functional attendance and a named owner. No meeting or no named owner is a High finding.
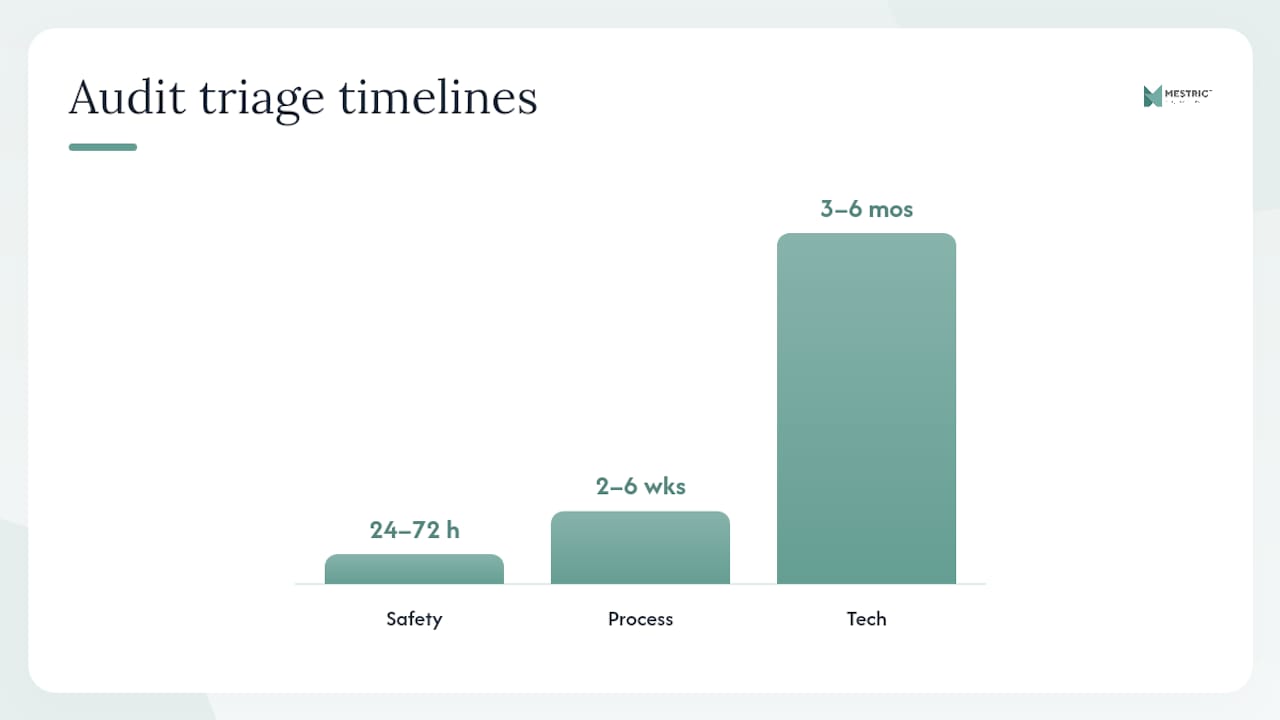
Pro Tip: Triage your findings immediately after the audit. Assign every High finding to a named owner with a 48-hour deadline. Process findings go into a two-week sprint. Tech findings go into a prioritised backlog. A finding with no owner is a finding that will not get fixed.
Realistic timelines once the audit is complete:
Not every fix requires a system change. Many of the most effective corrections are process and governance changes you can make this week.
Establish a PO acknowledgement workflow with three stages: (a) supplier acknowledges the PO within 48 hours of issue; (b) planner updates the ERP commit date within 24 hours of acknowledgement; © any unacknowledged line after 48 hours triggers an exception alert to the planner. This workflow, described in raw materials procurement best practice guidance, significantly reduces manual expediting and the inventory buffers that planners build to compensate for unreliable dates.
Run a BOM data-cleansing sprint. Assign one planner to verify the top 20 BOMs against actual build records. Use the ECRS method (Eliminate redundant components, Combine duplicate entries, Rearrange sequences, Simplify units of measure) to reduce complexity while you clean. Process improvement through ECRS and Lean principles is well-suited to this kind of structured data work.
Set a lead-time review cadence. Quarterly is the minimum for A-category materials; monthly for any item with a single source or recent delivery problems.
Complete an ABC segmentation of your raw materials. Then add a supply-risk flag for any item with a single source, a lead time above 12 weeks, or a history of delivery failures. These flagged items need tighter controls regardless of their ABC category.
| Problem type | Production impact | Effort to fix | Recommended first action |
|---|---|---|---|
| Unacknowledged POs | High: line stoppage risk | Low | PO sweep + supplier contact today |
| Inaccurate BOM data | High: wrong material quantities ordered | Medium | BOM-vs-build audit for top 20 products |
| Wrong safety stock | High: stockout on variable-lead items | Low | Recalculate using lead-time σ for top SKUs |
| Stale ERP lead times | High: incorrect reorder points | Low | Update ERP within 24 hours of audit |
| Forecast bias | Medium: excess stock or shortages | Medium | FVA analysis; single-number plan discipline |
| No ABC segmentation | Medium: planner time misallocated | Low | Complete ABC + supply-risk flag |
| Spreadsheet workarounds | Medium: version control and error risk | Medium | Map to ERP replacement; 30-day plan |
| No S&OP governance | Medium-High: misaligned demand signal | Medium | Assign owner; set monthly cadence |
Two concepts from supply chain research are particularly relevant to UK manufacturers working to reduce planning errors: shift-left planning and the persistence of forecast bias.
Arkieva’s CEO, writing for SupplyChainBrain, argues that most plans fail not because of poor forecasting but because feasibility checks and risk assessments happen too late in the planning cycle. By the time a planner discovers that a critical material cannot be sourced in time, the production schedule is already committed and the cost of re-planning is high. Shift-left planning moves those checks earlier: validating material availability, supplier capacity, and lead-time feasibility before the schedule is locked, not after.
The practical implication for UK plants is to pilot shift-left on your most constrained SKUs first. Before confirming a production order, run an automated check against confirmed PO commit dates and current stock. If the check fails, the exception surfaces before the order is released, not on the day the line is due to start.
This finding matters because many planning teams invest in better statistical models and see MAPE improve without seeing any reduction in over-procurement or stockouts. The reason is that bias is often cultural: sales teams forecast high to protect their targets; finance adjusts numbers to meet budget commitments; the result is a demand signal that is systematically distorted before it reaches your MRP.
Fixing forecast bias requires governance changes alongside technical ones. Three recommended steps:
A related governance risk is turning forecasts into irreversible commitments too early. Staging procurement decisions, preserving optionality on long-lead items, and using scenario testing for high-uncertainty periods all reduce the structural cost of forecast error.
The mistakes listed in this guide are well-known. The harder question is why they persist, and which fixes actually stick in a UK manufacturing environment.
The most common organisational blocker is not technology. It is siloed incentives. Procurement is measured on purchase price variance, so it resists holding safety stock. Sales is measured on revenue, so it inflates forecasts. Production is measured on output, so it hoards materials. No single team has an incentive to optimise the whole system, and the planner sits in the middle absorbing the consequences.
The second blocker is under-resourced planning teams. Many UK plants run their entire raw-material planning function on one or two people, often with a heavy administrative burden. When those individuals leave, they take with them years of undocumented knowledge: which supplier always runs two days late, which BOM has a known error that everyone works around, which product has a seasonal demand spike that the system does not capture. Practitioner analysis from Supply Chain Management Review describes this precisely: the planner becomes the system’s missing semantic layer, and when they leave, the fragility becomes visible.
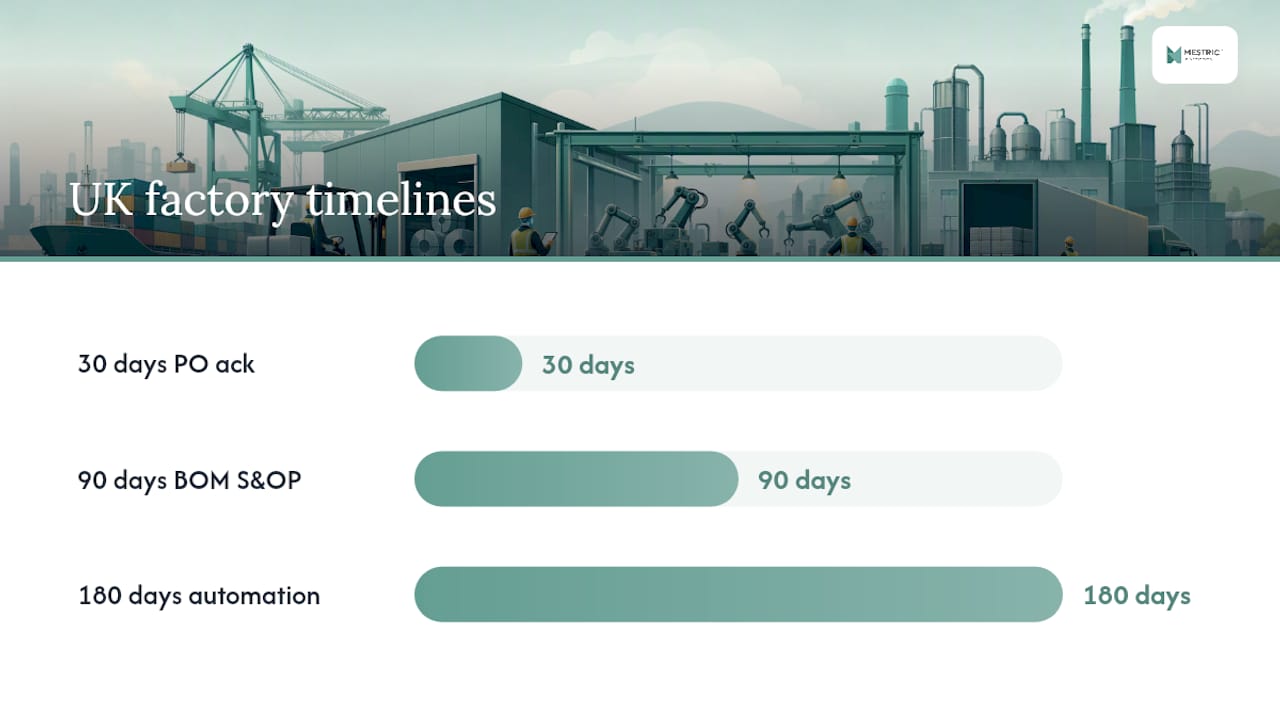
The sequencing that works in practice is: immediate containment first, then process standardisation, then automation. Trying to implement a new MES before the PO acknowledgement process is working is a common and expensive mistake. The technology amplifies whatever process is underneath it.
Realistic timelines from UK factory experience:
The 180-day mark is also when it becomes clear whether the remaining problems are process problems or system problems. If your team is still spending significant time on tasks that a connected MES could automate, that is the right moment to evaluate a technology investment.
Real-time visibility is the single biggest gap between a plant running on spreadsheets and one running on a connected system. When your production data, inventory records, and supplier commitments update automatically, the manual errors, stale records, and invisible exceptions that drive most planning failures simply have fewer places to hide.

Mestric’s MES addresses several of the mistakes covered in this guide directly. Real-time inventory tracking reduces stock-record discrepancies by capturing transactions at the point of occurrence rather than relying on end-of-shift data entry. Automated KPI dashboards give planners immediate visibility of stockout risk, PO status, and production performance without building a report from scratch. Quality monitoring and lot-traceability tools support the receiving and inspection controls that prevent mid-production rejects. And AI-powered analytics help identify patterns in supplier performance and demand variability that manual analysis would miss.
The right moment to evaluate a MES is when process fixes alone are no longer keeping pace with the complexity of your operation: when you have more than 500 active raw-material SKUs, when your planning team is spending more time expediting than planning, or when unacknowledged POs are a recurring cause of line stoppages despite a defined workflow. For plants at that stage, comparing MES against traditional manufacturing approaches gives a clear picture of the efficiency gains available. You can also explore real-time performance tracking to see how connected data reduces the visibility gaps that drive most planning errors.
Book a demonstration with Mestric to see how the platform works in a production environment similar to yours.
The sources below underpin the guidance in this article. Each is worth reading in full if you want more depth on a specific topic.


 069 763 552