


Effektiv upravljanje delovnih resursov v proizvodnji rests on five interdependent workforce pillars, executed through real-time, MES-enabled shop-floor visibility. Start this week with a diagnostic: pull attendance, OEE, and work-order adherence data, and run a short shop-floor visibility pilot on one line. Mestric™ users pairing structured methods with connected execution can expect the kind of gains Applied Sciences found in automated scheduling: production costs cut by up to 25% and lead times shortened by more than half.
Kurzfassung:
- Focusing on a single line pilot with clear success metrics and a narrow scope can demonstrate measurable improvements before scaling up.
- Integrating work orders, time and attendance, and skills data into a unified MES system enhances real-time visibility and resource utilization.
- Using scenario analysis with detailed workforce availability can improve capacity planning accuracy and resilience against disruptions.
- Tracking five key KPIs—labour utilization, labour cost per unit, schedule adherence, OEE, and fill rate—enables early identification of resource management issues.
- Phased implementation, starting small and proving value with live data, increases the likelihood of successful digital workforce management adoption.
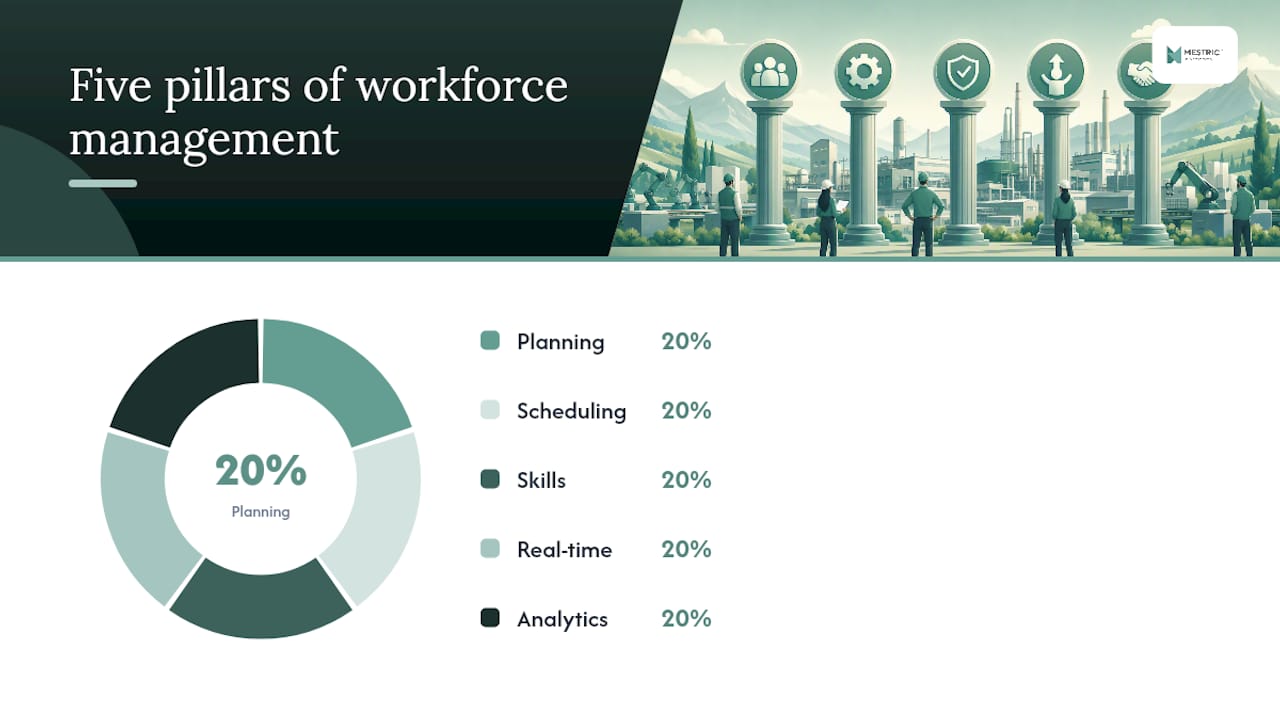
Workforce and resource management in production, or upravljanje delovnih resursov v proizvodnji, is not one discipline. It is five, and most Slovenian plants get one or two right while leaving the rest to habit and spreadsheets. Industry guidance from HiBob frames manufacturing workforce management as five interlocking pillars: planning and forecasting, scheduling and allocation, skills and cross-training, real-time performance management, and workforce analytics. Miss one, and the other four underperform.
These pillars need a rhythm to stay connected. Weekly huddles should review schedule adherence and short-term absence risk. Monthly reviews should reassess the skills matrix against upcoming order mix and flag training gaps before they become bottlenecks. Quarterly planning should revisit capacity forecasts against actual demand trends and recalibrate headcount or shift patterns accordingly.
The mistake most operations managers make is treating scheduling as the whole job. It is one-fifth of it. A plant with a brilliant scheduling tool but no skills matrix will still put an unqualified operator on a critical machine during a bad week, and a plant with excellent analytics but no real-time performance visibility will only discover the problem after the shift ends.
You do not need a twelve-month transformation programme to see results. A phased approach, starting small and proving value before scaling, works better and meets less resistance from the shop floor.
Pro-Tipp: Do not skip the skills matrix step because it feels administrative. A phased pilot integrating MES machine feeds with even one line’s workforce data and two weeks of work-order history is usually enough to show measurable utilisation gains before you commit to anything larger.
Pilots fail most often when success criteria are vague or when the stakeholder who owns the data integration is unclear from day one. Fix both before the first shift of your pilot starts, not after.
Each system in a modern plant owns a different slice of the data, and confusing their roles is where most integration projects stall. Your ERP owns financial and order data: what was sold, what it costs, what materials are on hand. Your MES owns execution data in real time: what is running on which machine right now, what quality checks passed, what downtime just occurred. Your WFM or HCM system owns people data: who is scheduled, who is certified for what, who is on leave.
The problem, as KPMG’s analysis of industrial manufacturing points out, is that these systems are usually fragmented. HR, payroll, and manufacturing execution rarely talk to each other, and that gap blocks visibility into what actually drives labour cost on the plant floor. Unifying them creates a single workforce-intelligence foundation instead of three disconnected data silos.
When you plan integration priorities, tackle these in order:
Three deployment patterns work well for Slovenian manufacturers moving from plan to execution. A phased MES pilot on one line lets you prove value without disrupting the whole plant. API-first integration connects existing ERP and WFM tools to a new MES layer without ripping out systems that already work. Frontline mobile access gives supervisors and operators shift and skills data on the floor, not just in an office terminal. Workforce platforms designed for manufacturing typically add skills-based scheduling, fatigue rules, and mobile shift-swapping on top of this foundation, cutting absenteeism and overtime costs.
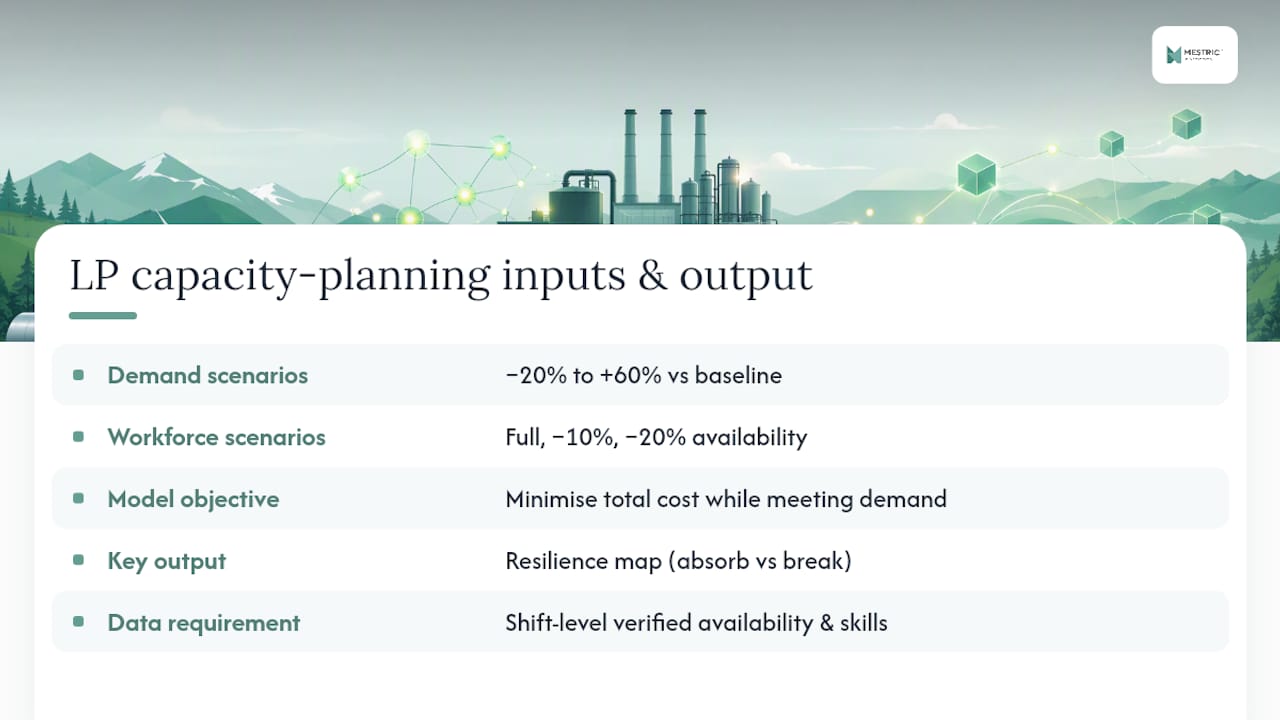
Most production managers treat capacity planning as intuition backed by a spreadsheet. A linear-programming model does the same job with far more discipline. At a practitioner level, an LP optimiser maps production volumes, machine-hours, and labour-hours across a planning period into a single objective: minimise total cost while meeting demand. The GitHub-hosted production planning optimiser demonstrates this mechanic clearly, allocating products, machines, and labour across periods while reporting idle capacity and utilisation by machine or worker type.
The practical value comes from scenario analysis, not the model alone. Build a grid crossing demand scenarios (say, minus 20% to plus 60% against baseline) against workforce-availability scenarios (full staffing, minus 10%, minus 20% for absence or turnover). Run the model across each cell and you get a resilience map: which combinations of demand and staffing your current plan can absorb, and which ones break it.
The difference between a resilient plan and a failed one is rarely the model’s sophistication. It is workforce-data granularity: tracking who is actually available, in what time blocks, with what verified skills, rather than relying on coarse headcount totals that hide the real constraint.
That caveat matters more than the modelling technique itself. A plan built on monthly headcount averages will pass every test on paper and still fail on the floor, because the model never saw the Tuesday afternoon shift with three certified welders instead of five. Include a shortfall or penalty variable in the model so it prioritises meeting real demand over an artificially clean-looking schedule, and feed it shift-level, not month-level, availability data. Get that right, and the same automation-driven approach behind the 25% cost reduction and 50% lead-time improvement becomes achievable rather than theoretical.
You cannot manage what you cannot see, and most plants track too many metrics badly rather than a few metrics well. Start with five: labour utilisation (productive hours against paid hours), labour cost per unit, schedule adherence (actual staffing against planned), OEE (availability multiplied by performance multiplied by quality), and fill rate (orders completed on time and in full).
Statistic to anchor your targets: automation-based scheduling and resource optimisation has been shown to cut production costs by up to 25% and shorten lead times by more than half, according to research on proactive manufacturing scheduling. That is the scale of improvement a well-run KPI programme, backed by real execution data, should be aiming towards over time.
Structure your dashboard in three tiers:
Close the loop with a simple PDCA rhythm: plan the target, do the shift, check the dashboard against target, act on the gap before the next shift starts. Weekly review of the five core KPIs, backed by a dashboard structured for shop-floor visibility, catches drift before it becomes a quarter’s worth of lost margin.
Scheduling and capacity planning are where workforce strategy meets the physical constraints of your plant, and treating them as separate problems is a common error. Capacity planning answers a longer-horizon question: given expected order volume over the next month or quarter, do you have enough machine-hours and labour-hours to meet it? Scheduling answers the short-horizon question: given today’s confirmed orders and today’s available staff, what runs on which machine, in what sequence, this shift?
The two must talk to each other constantly. A capacity plan built without real scheduling constraints, such as certification requirements or fatigue rules, will look feasible on paper and fail in execution. Equally, a scheduler working shift-by-shift without visibility into the quarter’s capacity plan will make locally sensible decisions that create a bottleneck two weeks out.
Good practice ties both to the same work-order data, so a schedule change automatically updates the capacity view rather than requiring a separate manual reconciliation. This is where MES-driven scheduling earns its place: it turns work orders into the single source of truth that both your long-range capacity planner and your shift supervisor reference, rather than each working from a different version of the plan.
Labour, machines, and tooling are three separate constraints, and most allocation failures happen when a plan optimises one while ignoring the other two. You can have the right operator and the right machine free, but if the tooling required for that job is being used on another line, the schedule breaks anyway.
Academic work on configurable, multidimensional resources, covering tools, machines, and workers with specific competencies, shows that proactive resource configuration helps plants keep schedules intact even when a resource is temporarily unavailable or missing a required capability. The practical takeaway is straightforward: your allocation system needs to track tooling availability and machine-specific certifications with the same rigour it applies to headcount, not as an afterthought.
Effective allocation also means matching skill level to task complexity deliberately, rather than defaulting to “whoever is free.” Putting your most experienced operator on a routine job while a less experienced one struggles with a complex changeover wastes capability on both ends. Build allocation rules that weigh certification, task complexity, and current fatigue or overtime exposure together, and update them as machine states change through the shift, not just at shift start.
Absence, turnover, and seasonal demand swings are not exceptions to plan around occasionally. They are the baseline condition every production schedule has to survive. Treating variability as an edge case is why so many schedules collapse the moment two people call in sick on the same morning.
A live skills matrix, updated whenever someone completes training or a certification lapses, is the foundation. It should show at a glance who can run which machine, who can perform which quality check, and who is cross-trained across which lines. Without it, supervisors default to putting the same handful of “reliable” people on every critical task, burning them out while others sit under-utilised.
Cross-training deliberately smooths variability. Rotating operators through adjacent tasks during quieter periods builds a bench of people who can cover for absence without a scramble. Fatigue rules matter just as much here as certification tracking: a workforce system that enforces rest periods and flags overtime risk prevents the kind of burnout that turns short-term variability into long-term turnover.
Mobile shift-swapping, where staff can trade shifts within approved skill and fatigue constraints, cuts absenteeism-driven disruption noticeably by giving people a legitimate way to manage personal conflicts without simply not showing up. Combine that with seasonal forecasting from your planning pillar, and workforce variability stops being a crisis and becomes a manageable, expected input to your weekly schedule.
Every resource allocation plan should assume something will go wrong, because on any given week, something usually does. A machine breaks down mid-shift, a key certified operator is unexpectedly absent, or a supplier delay throws material availability off. Contingency planning is not pessimism; it is the difference between a two-hour disruption and a two-day one.
Build contingency triggers into your scheduling rules rather than improvising when a crisis hits. Define in advance which secondary machines can absorb overflow if a primary line goes down, and which cross-trained staff can step into a critical role at short notice. Scenario analysis, the same demand-and-availability grid used in capacity planning, doubles as a risk tool: run your plan against a “key machine down” or “20% absence” scenario and see where it breaks before it actually happens.
Document escalation paths clearly: who decides to pull staff from another line, who approves overtime, who contacts a backup supplier. Ambiguity at the moment of disruption costs more time than the disruption itself. A shortfall variable in your optimisation model, one that flags unmet demand rather than hiding it, gives you an early warning signal rather than a surprise at month-end reporting. Review near-miss disruptions monthly alongside your skills matrix and capacity plan, because most real risks repeat in a pattern once you start tracking them properly.
The best workforce system in the world fails if the people running it on the floor do not trust it or understand it. Change management is not a training afterthought bolted onto a system rollout; it needs to run in parallel with the technical implementation from day one.
Start with the supervisors, not the wider workforce. They are the ones who will field questions and complaints in the first two weeks, so they need to understand not just how to use a new scheduling or MES tool, but why it changes their daily routine and what problem it solves for them specifically. A supervisor who sees the tool cut their own administrative burden will sell it to their team far more convincingly than a memo from head office.
Roll out training in short, task-specific sessions tied to actual shift routines, rather than one long classroom session covering every feature. Pair each new feature with a visible early win: if mobile shift-swapping cuts a supervisor’s Monday-morning scramble, point that out explicitly in week two.
Expect resistance around data visibility. Workers sometimes see real-time performance tracking as surveillance rather than support, so framing matters. Position dashboards as tools that flag problems early enough to fix them, not as scorecards used against individuals, and involve frontline staff in defining what “good” looks like on the metrics that affect them.
The pattern across successful rollouts is consistent: start narrow, prove value fast, and only then expand scope. Plants that try to integrate ERP, MES, and WFM systems simultaneously across every line tend to stall for months without a single measurable win to point to, which erodes support before the project delivers anything.
The stronger pattern is a phased pilot: connect one line’s MES machine feed, one line’s workforce data, and two weeks of work-order history, then measure utilisation and lead-time change directly against that baseline. This scale of pilot is usually enough to surface measurable improvement before a wider rollout, giving management a concrete result to justify further investment rather than a projection.
AI-assisted allocation engines are increasingly part of that pattern too. Rather than a planner spending hours manually balancing machine, labour, and material constraints, optimisation engines can compress that work into minutes, producing allocation suggestions a supervisor reviews and approves rather than builds from scratch. The common thread in every implementation that sticks: the pilot’s success criteria were defined and measured before the rollout began, not assessed retroactively once enthusiasm had already faded.
Most rollout failures we see share one root cause: teams try to fix scheduling, skills tracking, and real-time visibility all at once, on every line, in month one. That is backwards. The plants that succeed pick one line, prove one measurable win, and let that result do the persuading for phase two.
On-site demonstrations consistently expose the gap between what a system promises on a slide and what it does on a real shop floor, connected to real machines, with real downtime happening in front of you. That is deliberately why Mestric™ runs demos on live production environments rather than staged data.
— Andraž
You have read the method. The question is whether your current tools can execute it, or whether you are still reconciling three spreadsheets to find out what happened on last Tuesday’s night shift. A platform built specifically to close that gap offers live KPI dashboards for OEE, downtime, and cost per unit, direct machine connectivity so data arrives without manual entry, and AI-powered suggestions that flag bottlenecks before they cost you a shift.
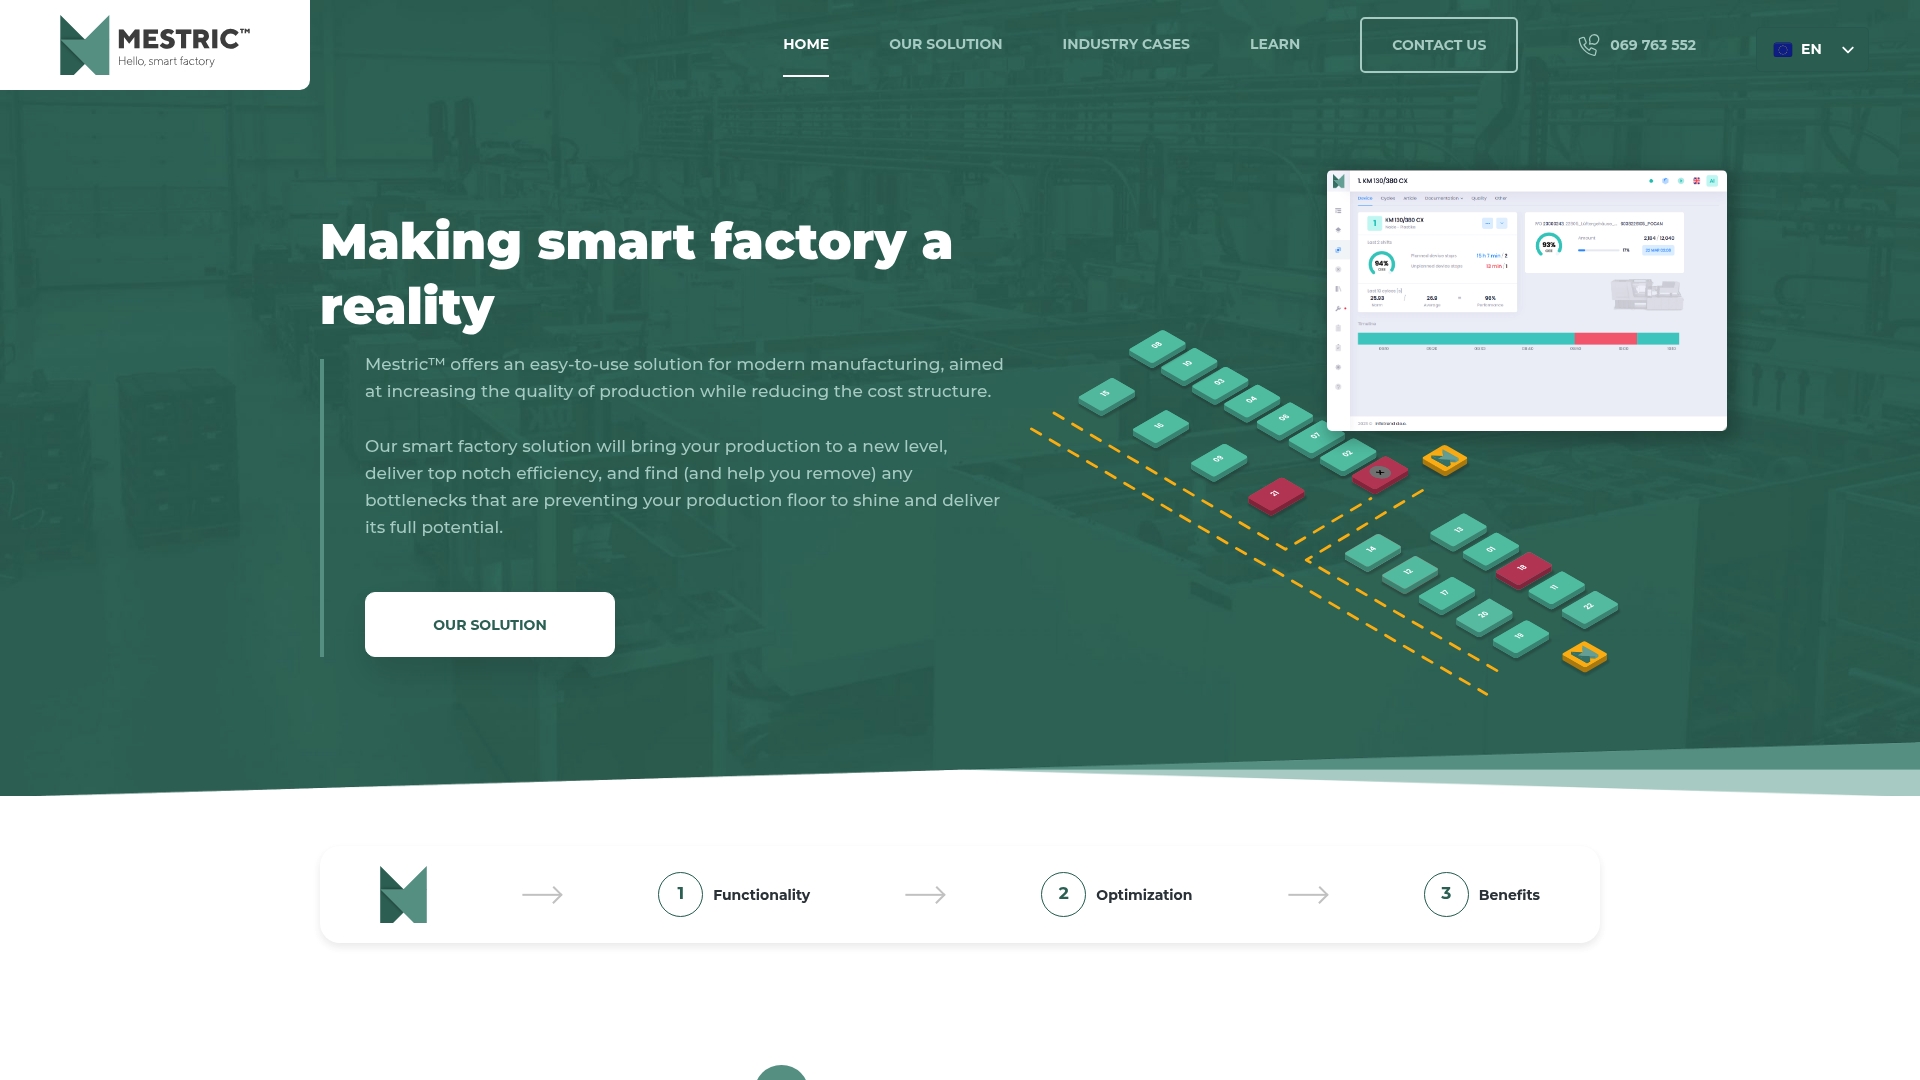
When you book a demonstration, come with three things to test: a live KPI scenario from your own plant, a checklist of what your ERP and workforce systems need to integrate, and the two or three pilot KPIs you would use to judge success on one line. That is exactly how a phased rollout should start, and it is the same approach outlined in the checklist above. Such a platform can show you what connected, real-time execution looks like against your own numbers, not a generic showcase.
Explore the Mestric™ MES solution and request a demo built around your own production data.
It refers to managing labour, machines, and tooling together in production, covering planning, scheduling, skills tracking, and real-time performance monitoring. The strongest approach combines the five-pillar workforce method with MES-enabled execution so decisions are based on live shop-floor data rather than estimates.
Automation-based scheduling and resource optimisation has been shown to cut production costs by up to 25% and shorten lead times by more than half, according to research on proactive manufacturing scheduling. The gains depend heavily on workforce-data granularity, not just the optimisation model itself.
Start with labour utilisation, labour cost per unit, schedule adherence, OEE, and fill rate, reviewed on line-level and shift-level dashboards. These five give the clearest early picture of where resource allocation is breaking down before deeper analytics become necessary.
Mestric™ connects directly to shop-floor machinery to provide real-time KPI tracking, downtime analysis, and AI-powered optimisation suggestions. Pricing and onboarding details are available on request through the Mestric™ MES solution page.
Choose one representative production line, connect its MES machine feed and workforce data, and measure utilisation and lead-time change over two to four weeks against a clear baseline. This scale of phased pilot is usually enough to justify a wider rollout without disrupting the whole plant.


 069 763 552